Network Analysis
Example of an expected search result
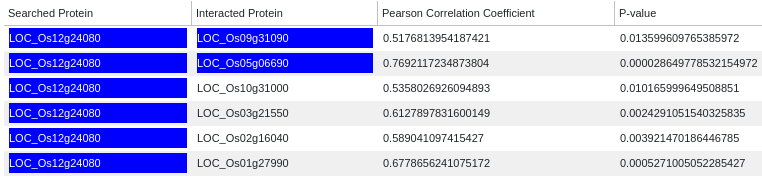
Interactive table with E3 Ligase-substrate interaction data (image captured below)
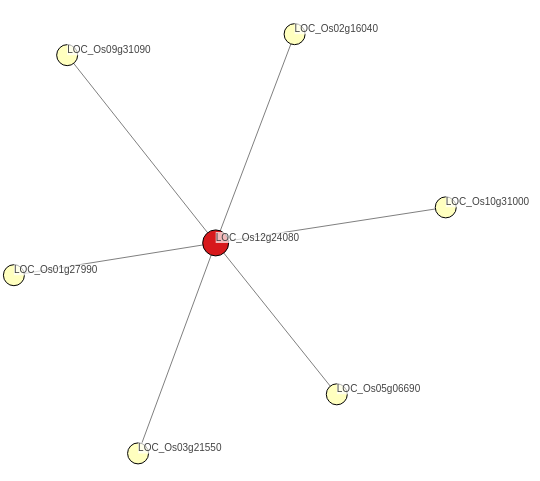
Interactive E3 Ligase-substrate network graph (image captured below)
Interactive table with E3 Ligase-substrate interaction data (image captured below)
Interactive E3 Ligase-substrate network graph (image captured below)